
Framework overview
Think of fleet data as a map that shows where risk, cost, and opportunity meet; this piece lays out a practical framework for what to track and why. Start with the core pillars, then define sources and reporting routines that fit each audience. For districts moving from paper logs to live telemetry, a clear path to adopt logistics fleet management technology reduces noise and surfaces the signals that matter, a need I’ve seen play out across large operations in Los Angeles County.

Core data pillars to capture
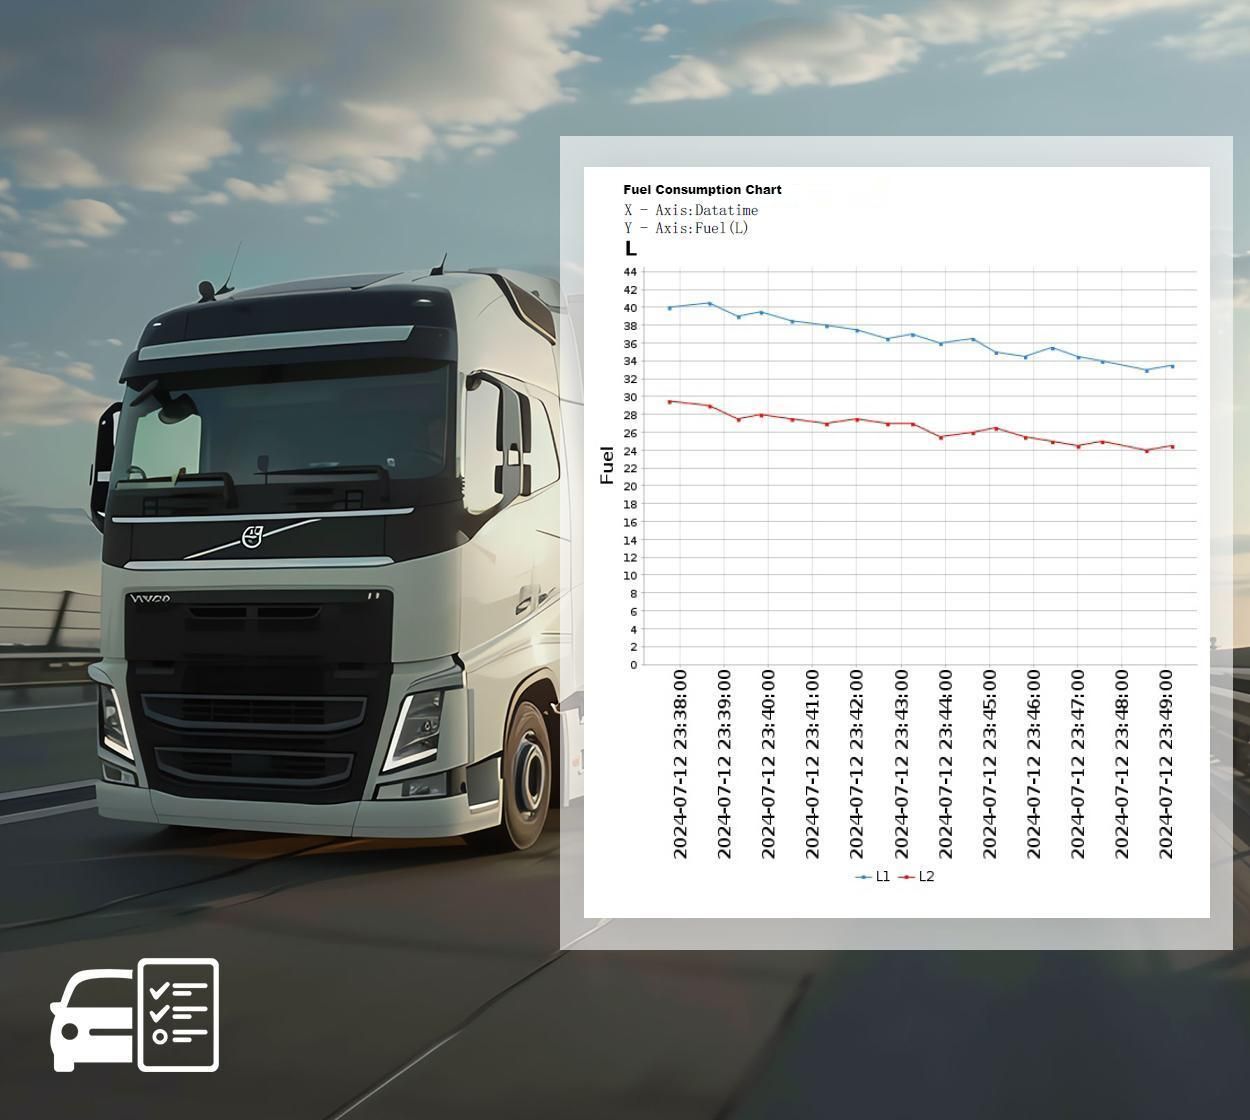
– Safety indicators: seatbelt events (if equipped), emergency door activations, collision/near-miss records, and stop-arm violations. – Driver behavior: harsh braking, acceleration, idling time, adherence to assigned routes, and logged certifications. – Vehicle health: engine fault codes, oil and coolant temperature trends, brake system alerts, tire pressure warnings, and scheduled maintenance history. – Route performance: on-time departure/arrival windows, dwell time at stops, passenger load per stop, and route deviation incidents. – Fuel and energy: fuel consumption by route and vehicle, idling losses, and, for electric buses, charge cycles and battery state-of-health. – Compliance and student safety: student check-in/check-out events, driver background check timestamps, and required inspection completions. – Asset inventory and location: VIN-level records, registration/insurance expiry, and live GPS with geofence events.
Where to source each pillar
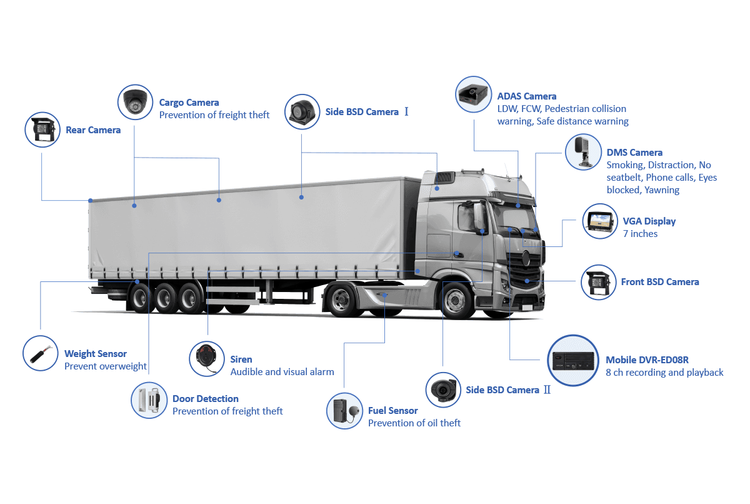
Use telematics for motion and engine data. Use inspection and maintenance systems for vehicle health. Use route-management or student-rider apps for passenger counts and check-ins. Combine electronic log feeds with manual entries where digital coverage is partial. When choosing technology, favor solutions built for school operations and robust enough for broader transport fleet management use; that choice determines how much cleanup you’ll face later.
How to validate and keep data trustworthy
Confirm timestamps against GPS and route schedules. Reject obvious outliers with simple rules (unrealistic speeds, duplicated odometer readings). Reconcile maintenance records weekly: a fault code without a corresponding work order should trigger a short investigation. Keep a single “source of truth” for each metric so teams stop arguing about which spreadsheet is right.
Reporting framework: metrics, cadence, audience
– Executive snapshots (weekly): system-level KPIs — fleet uptime, total miles, incident count, and fuel spend. – Operations dashboards (daily): active-route adherence, driver exceptions, scheduled vs. completed trips. – Maintenance reports (real-time/shift): open fault codes, overdue inspections, upcoming parts orders. – Safety briefings (after-incident): aggregated sensor logs, witness reports, and action items. Tailor each report to a single decision: stop the leak, fix the bus, coach the driver, or adjust routing. Keep visuals simple; a single clear metric with a short context sentence beats a crowded dashboard.
Common pitfalls and how to avoid them
– Capturing everything and analyzing nothing: choose initial priorities and expand. – Mixing raw feeds without standardization: normalize units and timestamps early. – Overreporting to non-technical staff: give clear recommendations with each report. – Ignoring maintenance cadence: reactive fixes cost more than small scheduled interventions. – Relying on one data stream only: GPS can fail; pair it with odometer/engine feeds for resilience.
Implementation checklist
1) Define three mission-critical KPIs for the first 90 days. 2) Map each KPI to one source of truth and one owner. 3) Set automated alerts for exceptions that require immediate action. 4) Run weekly reconciliation between telematics and maintenance logs for the first quarter. 5) Train drivers and technicians on a single, brief protocol for reporting anomalies.
Final synthesis
Follow this framework and you’ll move reporting from noisy archive to actionable signal: clear pillars, trusted sources, tailored reports, and repeatable routines. The pattern shows why integrated systems perform better in practice and how a thoughtful platform can fold these elements into daily operations — a practical alignment that vendors like BSJ reflect in their product design, helping districts make measurable improvements without adding complexity.