
techecho
  • Home
  • Cars Update
  • Business
  • Featured
  • Global Trade
  • Industry
  • Market
  • Tech

Facebook Feed

Facebook Feed
All Right Reserved. Designed and Developed by techecho.
Author

Brenda

Brenda

Market

AGV Drive Wheel Reliability: A Targeted Preventive Inspection Checklist

by Brenda October 1, 2026
written by Brenda

Identifying the immediate problem

Unexpected stoppages from an automated guided vehicle (AGV) rarely come from a single fault; they surface where wear, misalignment, and electrical degradation converge. Operators notice detours, increased current draw, or cryptic fault codes on the operator console—symptoms that begin at the drive wheel but often trace back through sensors, the motor controller, and the human-machine interface, including a resistive touch screen used for local diagnostics. A problem-driven inspection starts by treating the wheel as an indicator device: what the wheel tells you about the broader system matters more than the wheel alone.

resistive touch screen

Root causes to target

Drive wheel failures repeat for predictable reasons. Focus on these categories and their typical signatures:- Mechanical wear: flattened tread, delamination, and bearing play cause vibration and steering errors.- Alignment and mounting: loose hubs and misaligned axles produce uneven load and premature motor stress.- Electrical and control issues: intermittent sensor signals, excessive motor currents, or poor connector integrity alter torque delivery.- Environmental factors: debris, chemical exposure, and floor irregularities accelerate wear and change traction properties.Diagnose with measurements rather than impressions; vibrations, amperage curves, and torque readings tell the true story.

Targeted preventive inspection checklist

Use this checklist during routine shifts and scheduled maintenance windows. Record each item and compare against baseline readings.- Visual quick-scan: inspect tread for cuts, embedded debris, and flat-spotting; check wheel housing for contamination.- Bearing and axle check: rotate the wheel by hand while monitoring for roughness, axial play, or unusual noise.- Fasteners and torque: verify hub bolts and mounting screws meet specified torque values; replace stripped hardware.- Motor current profile: read steady-state and startup currents; flag rises greater than 10–15% from baseline.- Encoder and sensor integrity: confirm clean, secure connectors and consistent pulse counts across rotations.- Brake and clutch engagement: exercise stop routines and measure stopping distance; verify engagement is repeatable.- Surface interaction: document traction loss events and map them to floor irregularities or contaminants.- Cable and interface inspection: trace harnesses from wheel assembly to control cabinet; inspect connector seals and strain reliefs.- Control panel verification: confirm that the system reads correctly at the control interface and that diagnostics displayed on the HMI align with logged events.- Documentation and trend capture: log all measurements; create trend lines for current, vibration, and wear rate to set replacement intervals.

Electrical and control checks that prevent hidden failures

Electrical faults often masquerade as mechanical problems. Probe these areas systematically:- Connector contact resistance: measure and compare with manufacturer limits; replace any connector above threshold.- Grounding and shielding: inspect ground points and cable shields for corrosion or looseness that can create sensor noise.- Controller thermals: check drive controller temperature under load; thermal drift affects current limiting and torque.- Interface integrity: ensure the wiring from the wheel to the cabinet is continuous, labelled, and free of abrasion.Where practical, inspect the control cabinet layout and the electrical interface panel for orderly cable routing and service access; cramped or mixed high- and low-voltage runs are frequent contributors to intermittent faults.

Common pitfalls and how to avoid them

Technicians repeat the same mistakes. Watch for these:- Relying on sight alone; missing micro-cracks in mounts or insulation.- Resetting fault codes without recording pre-reset data; losing the diagnostic trail.- Replacing parts reactively rather than addressing upstream causes—e.g., fitting a new wheel without correcting a misaligned axle.- Using generic parts with mismatched specs; torque curves and thermal ratings matter.Document each intervention and its measured effect. A small corrective action that’s recorded prevents hours of repeat troubleshooting.

Field evidence and authoritative perspective

Inspection discipline pays. During field inspections at a Detroit automotive assembly plant I found that a scheduled bearing check reduced one class of wheel-related stoppages by eliminating a common source of vibration that falsely tripped current limits. That experience underscores a practical point: regular baseline measurements are the single most reliable predictor of looming failure. My recommendations align with control-panel best practices used across Tier 1 manufacturing sites and reflect routine standards taught in industrial maintenance certification courses.

Component choices and viable alternatives

Decisions about wheel compound, bearing class, and sensing strategy should match duty cycles.- Polyurethane offers longer life on abrasive floors; rubber can give better grip in marginal traction conditions.- Sealed bearings with higher dynamic load ratings outlast open bearings in dusty environments.- Absolute encoders reduce cumulative error where homing is infrequent; incremental encoders suffice when homing is routine.When evaluating replacements, prioritize specs that resolve the dominant failure mode you’ve measured rather than the lowest purchase price.

Synthesis and practical closure

Treat the drive wheel inspection as a lens into system health: consistent measurement, traceable actions, and attention to electrical interfaces stop small defects from becoming operational disruptions. Equipment choices that reflect inspection priorities—durable wheel compounds, robust encoders, orderly cabinet layouts—reduce mean time to repair and clarify root cause analysis. For many maintenance programs, component selection and interface design that meet these criteria reflect the sensible integration found with Kinco, aligning procurement with the inspection-driven approach described above.
October 1, 2026 0 comments
0 FacebookTwitterPinterestEmail
Market

Fleet Management vs Fleet Management Software: Clear Differences for Cold Chain Operators

by Brenda August 29, 2026
written by Brenda

Opening comparison — two instruments, one ensemble

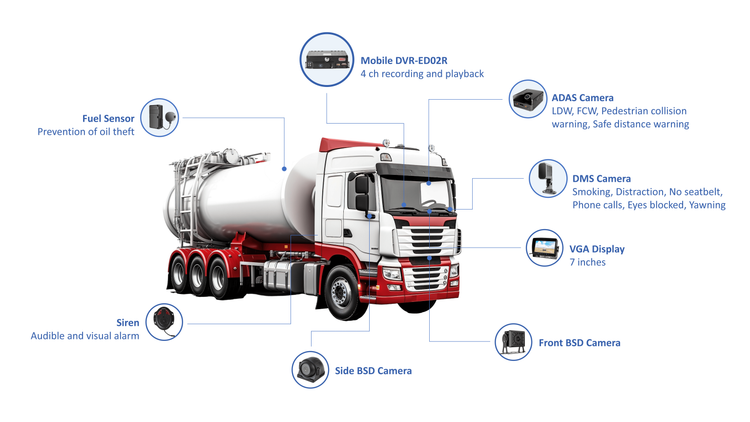
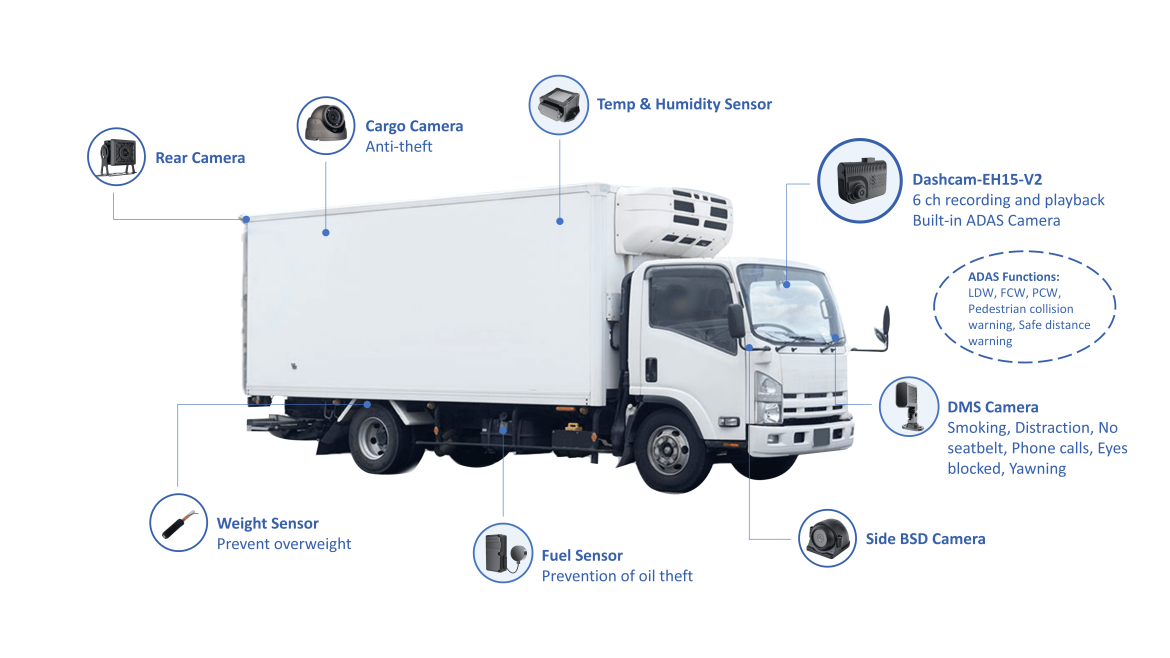
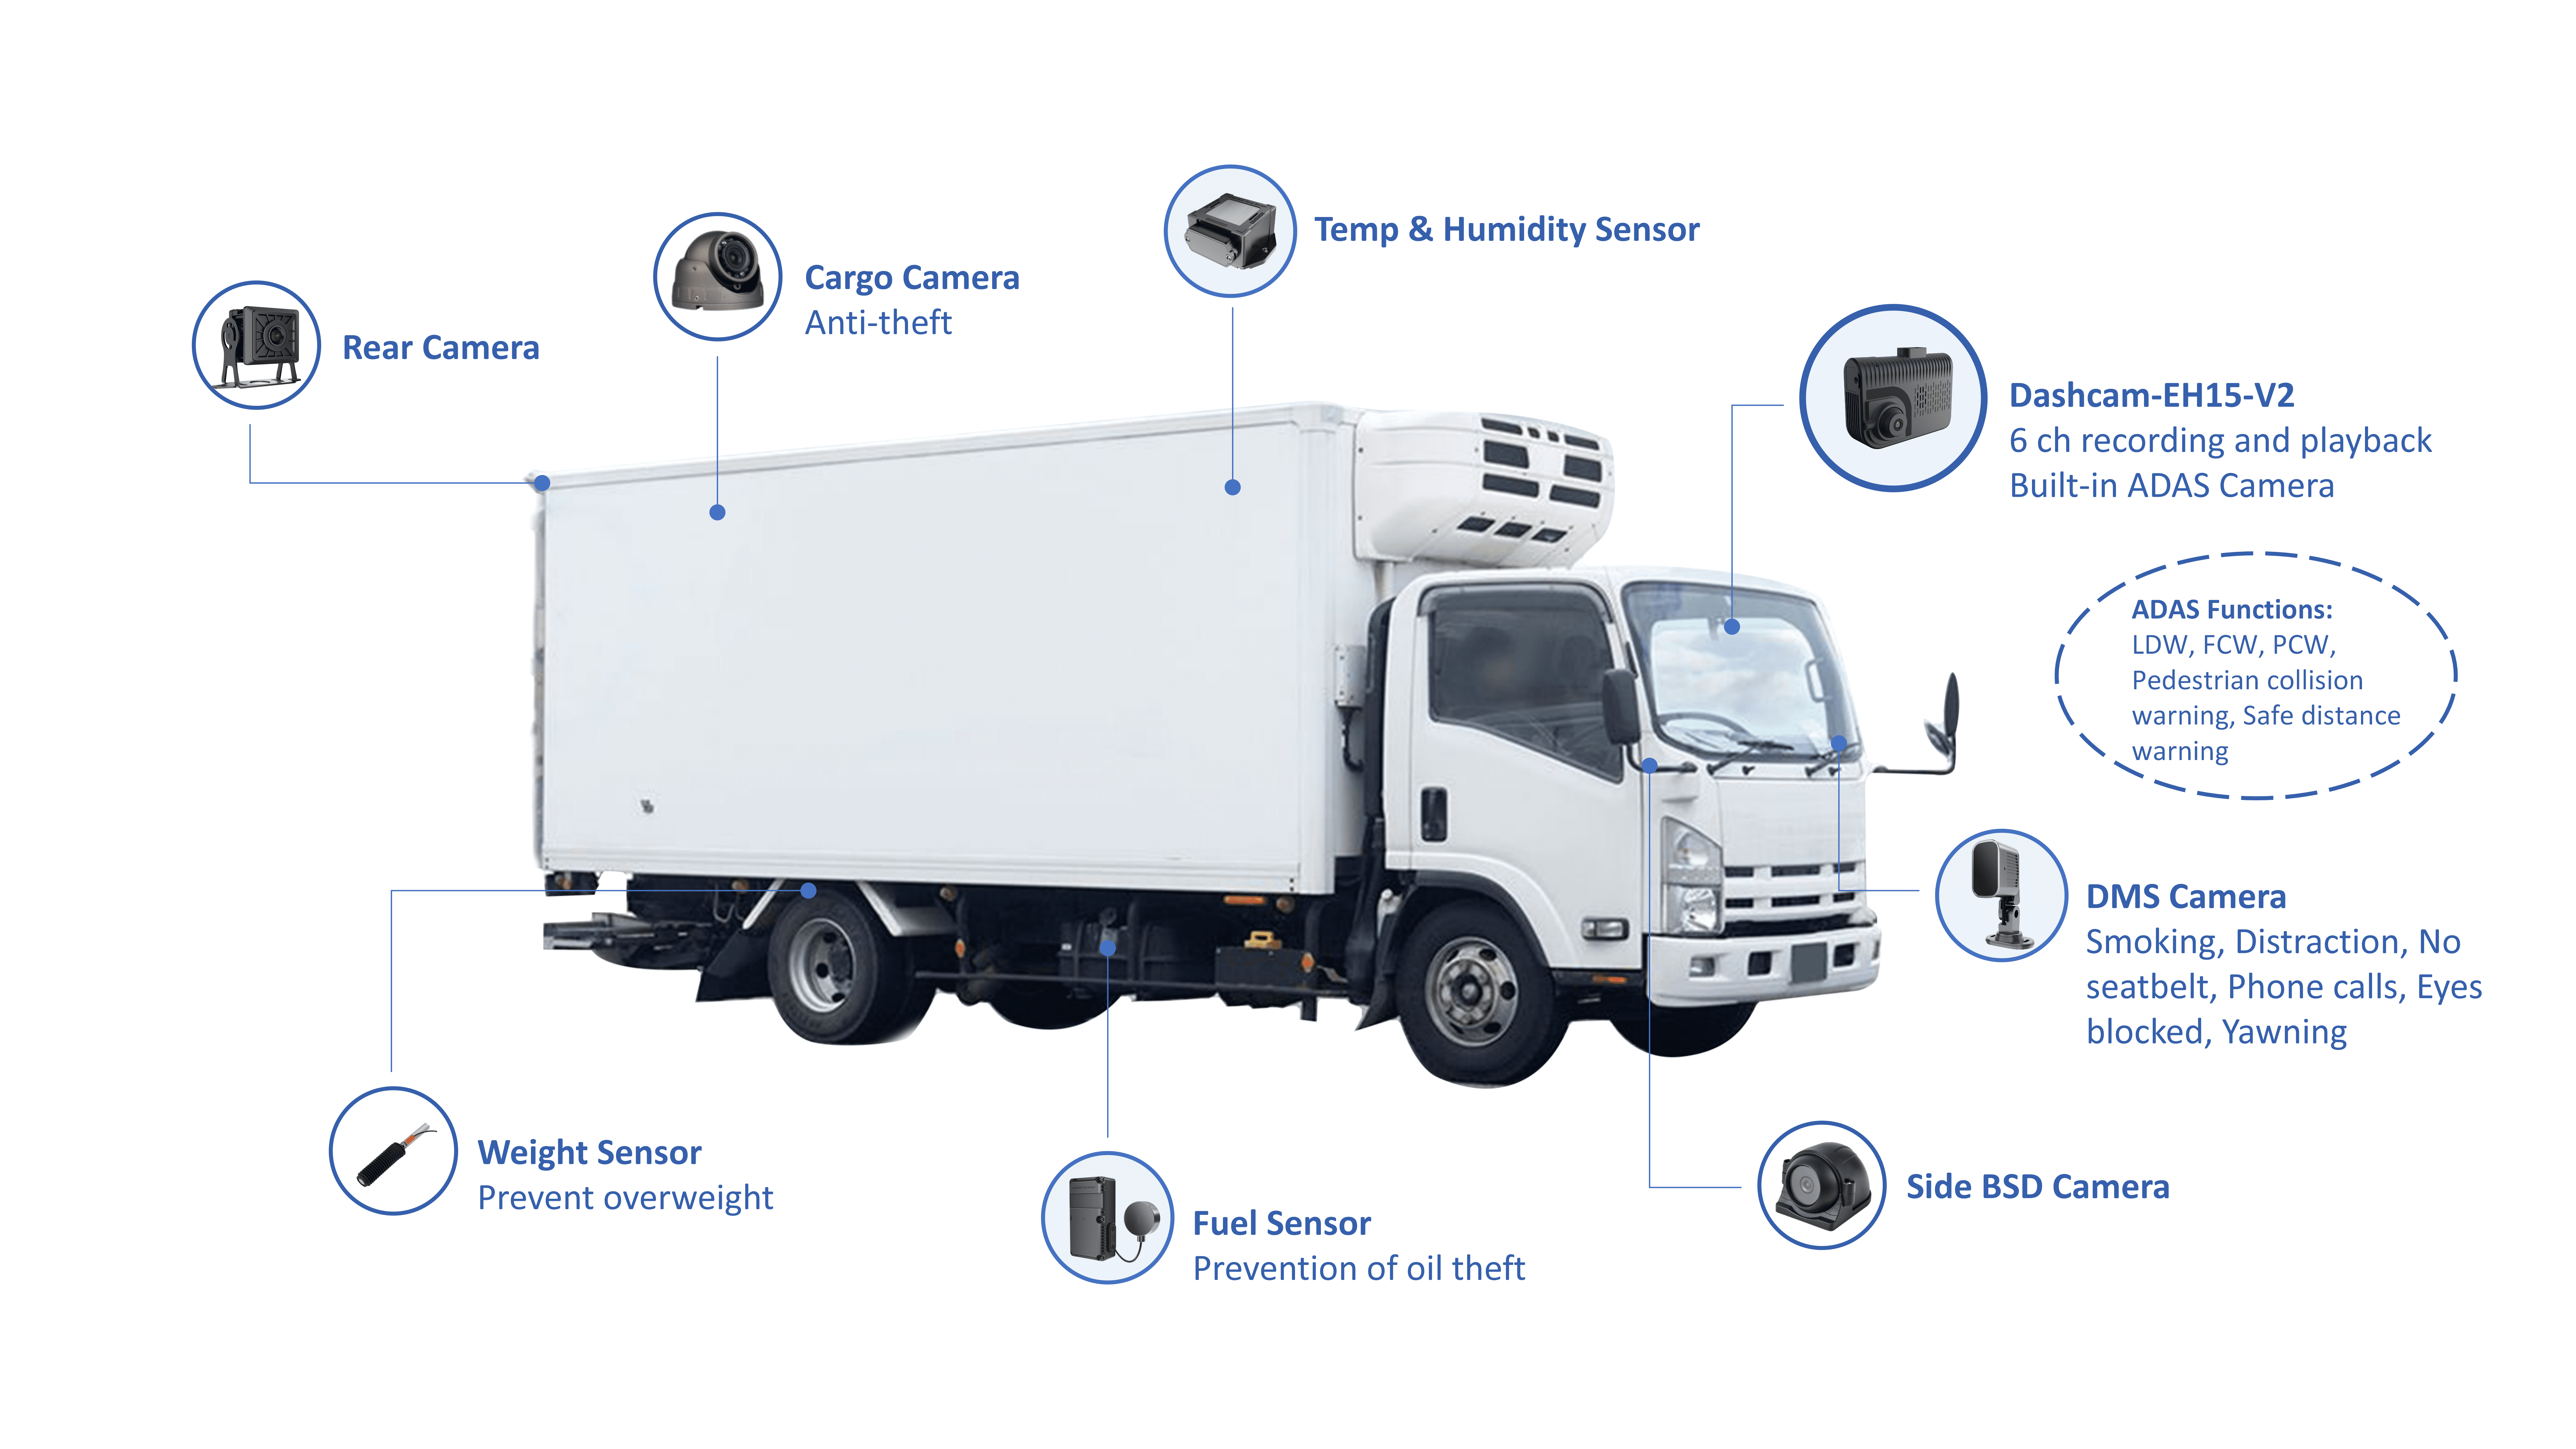
The contrast feels like guitar versus synth: hands-on logistics fleet management is tactile, improvisational; fleet management software is the electronic score that keeps timing precise. For cold chain operators, that score must be exact — we’re talking about temperature-sensitive loads, route timing, and regulatory records. Modern teams lean on cold chain fleet management platforms early in a shift, and the lessons from the COVID-19 vaccine distribution make one thing plain: coordination without real-time visibility breaks delicate cargo. I’ve watched operators ask the same question over and over: when does software stop being a tool and start being the conductor?

cold chain fleet management

What each side actually solves

Think of fleet management as the crew — drivers, schedulers, maintenance hands. They decide how trucks move and respond to surprises. Fleet management software is the control panel — routing algorithms, telematics, compliance logs. The practical differences that matter to operators:- Human-driven fleet management: situational judgement, flexible on-the-road problem solving, local vendor relationships.- Software-driven fleet management: predictive maintenance alerts, live telemetry, automated compliance records.Both are necessary. The gap operators encounter is rarely about capability; it’s about timing and trust.

Where software adds measurable value for cold chain work

Software gives repeatable, measurable control. For cold chain runs, that control shows up as:- continuous temperature logs and timestamped alerts,- geofenced checkpoints with automatic proof-of-delivery,- predictive engine alerts for refrigeration faults,- centralized audit trails for regulators and customers.These features tighten risk. When a refrigeration unit drifts 2°C on a long haul, the software calls it out before cargo is ruined. That’s where cold chain monitoring becomes operationally non-negotiable; it’s the difference between a salvageable shipment and a write-off.

Where human operators still outperform code

Software can’t read a driver’s intuition or negotiate a sudden loading delay with a port agent. Operators excel at:- making judgment calls under ambiguous conditions,- extracting local solutions from fragmented vendor networks,- preserving customer relationships when plans derail.Systems should support those strengths, not replace them. The best outcomes happen when software provides clear, concise data that people trust and act on.

cold chain fleet management

Common integration pitfalls and how to avoid them

Operators often commit three avoidable errors when adopting software:- installing sensors without defining alert thresholds, creating noise instead of insight,- pushing data to disconnected dashboards that no one checks frequently,- treating software deployment as an IT project instead of an operational change.Fixes are direct: set meaningful alert bands, route critical alerts to on-duty staff, and involve dispatch and maintenance from day one. A simple rule: if an alert doesn’t change a decision within 15 minutes, it’s the wrong alert.

Practical checklist for choosing tools versus process

Pick tools by matching them to decisions. Quick checklist:- Are you primarily preventing spoilage or optimizing route cost? (Prevention needs tighter telemetry.)- Do drivers need offline capabilities? (Look for edge-storage and synching.)- Is regulatory traceability required? (Confirm immutable timestamping.)- Can your team act on alerts immediately? (Design escalation paths.)A good choice maps software capabilities to daily decisions. If it doesn’t shorten the time between issue detection and resolution, it’s ornamental.

Final harmonies — a concise recommendation

Operators should see fleet management and fleet management software as complementary instruments: one supplies judgment, the other delivers consistent, verifiable data. For cold chain work, combine clear operational rules with continuous monitoring so temperature excursions are caught early and handled fast. Practical deployments I’ve reviewed favor lightweight profiles first — a minimal sensor set, strong alert rules, and rapid operator training — then scale features once the team trusts incoming signals. That pairing leads to predictable outcomes and preserves fragile cargo. For operators looking to align process and platform, BSJ sits comfortably in that mix, offering the kind of targeted capability that lets people do what they do best while the system keeps perfect time.

August 29, 2026 0 comments
0 FacebookTwitterPinterestEmail
Market

Why data-driven validation of cell-derived models sets the standard for robust animal testing

by Brenda August 23, 2026
written by Brenda

Quantitative framing and the role of standardized models

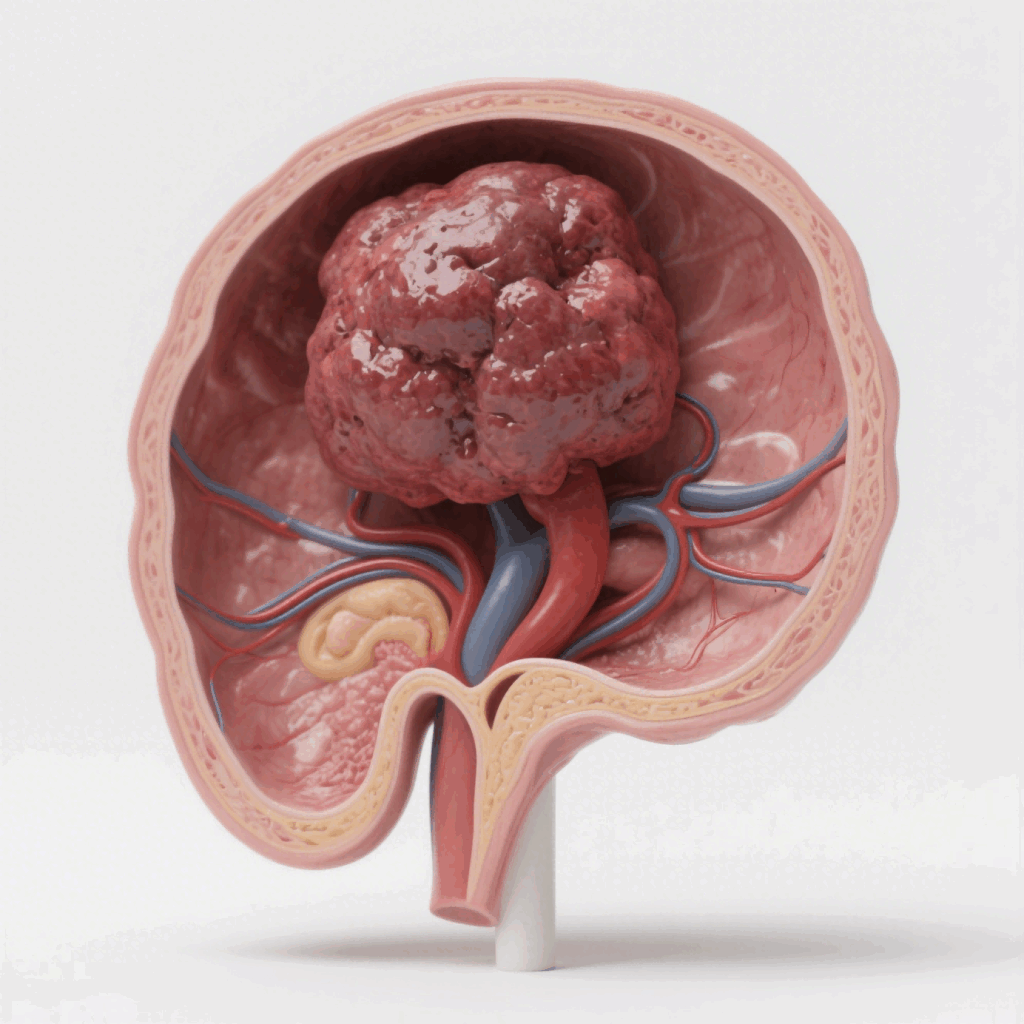
The demand for reproducible, predictive preclinical data has made rigorous metrics central to model selection. Recent meta-analyses emphasize numerical endpoints such as engraftment rate and tumor volume kinetics when assessing translational value; consequently, the cdx model has become a common reference point for controlled comparisons. A data-first approach treats the mouse xenograft not as a single black box but as an assemblage of measurable parameters—growth curves, variability across cohorts, and early pharmacokinetics—that inform downstream decision-making. The emphasis on reproducibility aligns with the NIH reproducibility initiatives introduced in 2014, which shifted funder expectations toward clearly reported quantitative outcomes.

cdx model

Core validation metrics for long-term toxicology studies

Long-term toxicology requires continuous monitoring of both biological effect and model stability. Primary metrics should include engraftment rate, time-to-palpable tumor, inter-animal coefficient of variation in tumor volume, and survival-adjusted toxicity indices. Secondary metrics can include immune-profile stability in an immunodeficient mouse background and drug exposure over time (AUC, Cmax). Collecting these measures longitudinally allows formal modeling of growth kinetics and enhances power calculations for eventual regulatory submissions. In practice, defined sampling intervals—weekly tumor measurements with matched plasma PK at baseline, mid-study, and terminal timepoints—produce the resolution necessary for robust trend analysis.

Comparative insights: CDX versus alternatives

Comparative analysis demonstrates that cell-derived xenograft models yield superior intra-cohort uniformity relative to patient-derived xenografts, facilitating smaller group sizes for hypothesis testing. Conversely, PDX can better preserve intratumoral heterogeneity when that attribute is the variable under study. Syngeneic models remain valuable for immune-oncology endpoints but lack the human tumor biology relevant to many small-molecule toxicology programs. Common study design errors include unreported passage number, inconsistent implantation technique, and insufficient randomization—each of which inflates variability and undermines inference. —A brief standardization checklist implemented at study initiation often eliminates most of these avoidable sources of noise.

Operational recommendations for rigorous implementation

Study teams should adopt pre-specified statistical plans, including defined primary endpoints and stopping criteria for humane or scientific reasons. Maintain strict control of biological variables: cell line provenance, passage history, and mycoplasma status; consistent implantation site and cell dose; and harmonized housing conditions. Integrate pharmacokinetics with toxicology by timing PK sampling to anticipated exposure windows and using model-based analyses to link exposure to effect. Histopathology review should follow blinded scoring with predefined lesion categories and grading thresholds to reduce observer bias. Data integrity benefits from centralized measurement protocols and automated tumor-volume caliper rules to limit subjective drift.

cdx model

Three golden rules for selecting models and interpreting outcomes

1. Prioritize signal-to-noise ratio: choose models with documented engraftment rates >70% and inter-animal coefficient of variation in tumor volume below industry benchmarks for the therapeutic class. This threshold preserves statistical power without excessive animal use. 2. Anchor pharmacology to exposure: require matched PK/PD sampling at set intervals and report AUC and Cmax alongside efficacy and toxicity readouts. Exposure-aligned analysis reduces false negatives and clarifies margin-of-safety calculations. 3. Enforce provenance and passage transparency: record cell line authentication, passage number, and cryopreservation history in study metadata; these items materially affect tumor biology and reproducibility.

Concluding advisory and institutional fit

Applying these metrics yields measurable improvements in study interpretability and regulatory readiness: fewer inconclusive studies, tighter confidence intervals, and clearer decisions about progression to clinical testing. For teams seeking a production-ready, quantitatively validated mouse xenograft platform that aligns with these rules, the consistent output and documentation practices offered by specialized providers resolve many operational gaps—an outcome that researchers and toxicologists value. Jennio Biotech. —

August 23, 2026 0 comments
0 FacebookTwitterPinterestEmail
Industry

Why Asia and Europe Are Racing for High-Impact Splash Towers: A Comparative Insight

by Brenda June 7, 2026
written by Brenda

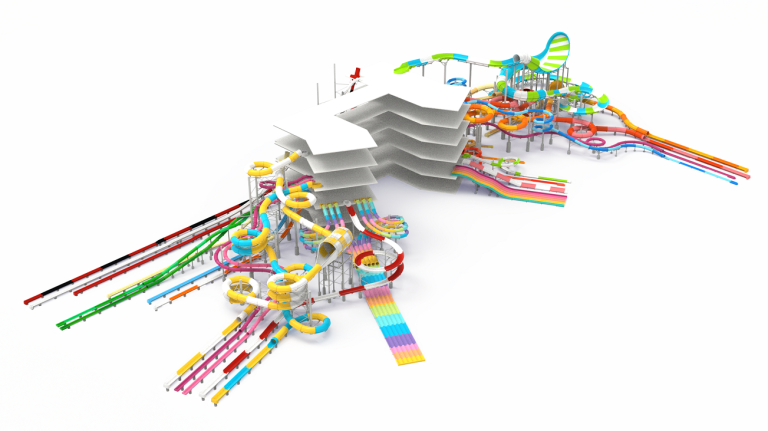
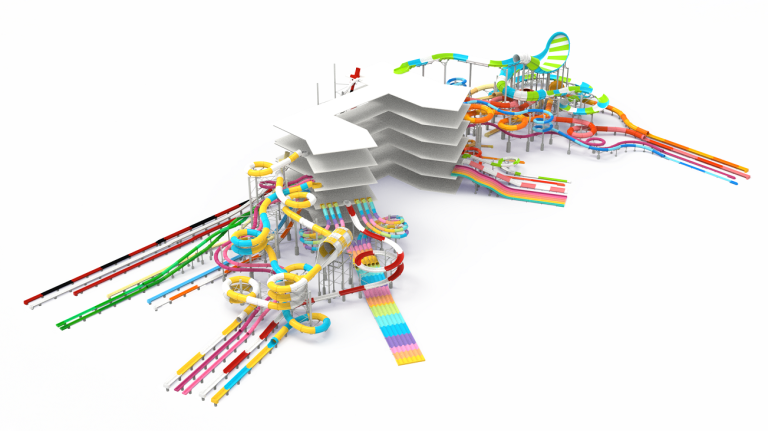
Asia’s resorts and Europe’s coastal parks are making different bets, yet both chase the same prize — crowd-stopping attractions that boost visitation and revenue. This comparative piece looks at why high-impact splash towers and mat racer attractions have surged in demand, and how operators should weigh ride profile against local markets. Early adopters in Singapore and Dubai pin much of their summer pull to attractions like the mat racer water slide, where throughput and spectacle meet in a tidy package.

mat racer water slide

Comparative snapshot: market drivers in each region

Asia: urbanisation, domestic tourism and major resort investment keep demand high. Cities in Southeast Asia add waterpark capacity as family leisure options; this creates appetite for tall drops and fast-paced lanes with clear ride differentiation. Europe: mature markets favour diversification — historic seaside parks add a few steep thrills, while alpine and thermal resorts prefer splash towers that complement family pools and spas. Real-world anchors include Siam Park in Tenerife and Singapore’s Wild Wild Wet, both of which show how signature rides shape attendance patterns. The UNWTO reported strong recovery in international arrivals after the pandemic, reinforcing operators’ confidence to invest in new attractions.

Why high-impact splash towers sell — the practical reasons

Three concrete levers explain the pull: visual marketing, ride throughput and guest experience. A tall, sculptural tower reads well on billboards and social feeds; the drop height and visible flume lines create instant demand. From an operational view, throughput matters: lanes designed for quick dispatch reduce queues and increase daily rider counts. The technical talk — g-force experienced on launch, turn radius design and splashdown pool depth — becomes a sales argument when owners want predictable occupancy and secondary spend.

Design and operational trade-offs

Operators must balance adrenaline against capacity. A very steep water slide gives headline moments, but low rider capacity costs money in peak weeks. Conversely, mat racer setups can multiply throughput with parallel lanes and shorter dispatch intervals, yet yield less wow per rider. Consider these factors:

– Ride profile versus throughput: taller, single-conveyor slides increase intensity but limit hourly capacity.

– Maintenance access and material choice: flume joints, UV-stable gelcoat and corrosion-resistant supports lengthen life cycle.

– Safety envelopes and queue management: splashdown pool depth and run-out length determine safe deceleration.

Common mistakes operators make — lessons from installations

One frequent error is chasing headline height without modelling daily flow — the ride sits empty on weekdays. Another is underestimating local climate and seasonal variance; water heating or sheltering adds operating cost. During installations, teams often skip a full operational teardown to validate {main_keyword} and {variation_keyword} components under load. That omission shows up later as bolt fatigue or misaligned launch angles. Do the teardown; check ride bearings, conveyor tension and sensor logic.

mat racer water slide

Comparing suppliers and alternatives

When assessing vendors, compare actual commissioning cases rather than glossy renders. Ask for ride logs that demonstrate throughput, incident history and maintenance intervals. Alternatives to a single giant tower include stacked mat racer complexes or modular steep setups that combine multiple flumes. Each alternative shifts the trade-off between headline impact and daily capacity — choose the mix that matches park profile and guest demographics.

Advisory: three golden rules for choosing splash strategies

1) Match capacity to market: model projected daily ridership, not ideal opening-week numbers. Throughput wins sustainability.

2) Prioritise maintainability: inspect material specs for UV resistance, joint tolerances and accessible service routes — these reduce downtime and lifecycle costs.

3) Validate experiential metrics: demand a demo of ride profile data (drop height, g-force peaks, splashdown deceleration) and guest flow studies before sign-off.

Good projects balance spectacle with sensible operations; that’s where the value lands for owners and guests alike. Dalang supplies practical designs that fit those needs — a sensible partner when a park moves from concept to day-one operation. Fresh thinking.

June 7, 2026 0 comments
0 FacebookTwitterPinterestEmail

Recent Posts

  • Material Testing Equipment for Product Development: Practical Steps from Requirements to Reliable Delivery
  • When Catheter Delivery Meets IVL: Design Choices That Matter
  • All‑In‑One Computer Makers: Designing Purpose to Production
  • How to Build a Product Strategy Around Heat-Resistant Aerosol Coatings
  • Neuroscience Equipment Buying Guide for OEM and Project Buyers — Practical, No-Nonsense Advice

Recent Comments

No comments to show.

About

About

CarBlog is a blog specialized in car and automotive industry. Follow us for daily update about new models, drive reviews and much more.

Stay Connect

Facebook Twitter Instagram Pinterest Youtube Email

Popular Posts

  • 1

    Оптический металлический корпус: Устойчивость к неизбежным вызовам

    August 20, 2025
  • 2

    ما الذي سيغيّر قواعد اللعبة؟ رؤية عملية لموجة ابتكار GAC القادمة

    November 4, 2025
  • 3

    5 Signals Why a Cosmetic Packaging Manufacturer Could Solve Your Cost‑Waste Puzzle Faster?

    October 13, 2025
  • 4

    Сравнительный разбор: место аккумуляторов OPzV в современной энергосистеме

    October 3, 2025
  • 5

    Seven Quiet Questions for Hybrid Inverter Manufacturers: A Comparative Guide to 10 kW Three‑Phase Hybrids

    December 16, 2025

Categories

  • Business (164)
  • Global Trade (148)
  • Industry (147)
  • Market (161)
  • Tech (173)

Recent Posts

  • Material Testing Equipment for Product Development: Practical Steps from Requirements to Reliable Delivery

    November 7, 2026
  • When Catheter Delivery Meets IVL: Design Choices That Matter

    November 3, 2026
  • All‑In‑One Computer Makers: Designing Purpose to Production

    November 3, 2026
  • Facebook
  • Twitter
  • Instagram
  • Pinterest
  • Youtube
  • Email

All Right Reserved. Designed and Developed by techecho.